What we design, develop and install:
Standard finished systems, until 200'000 kWh/a
Custom designed systems, until 2'400'000 kWh/a

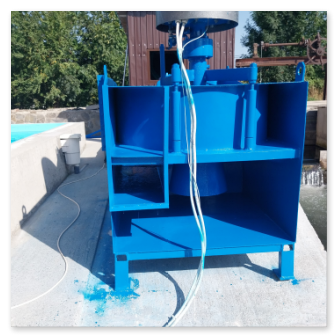
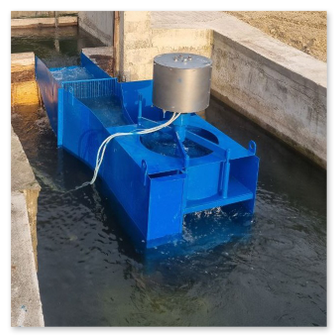
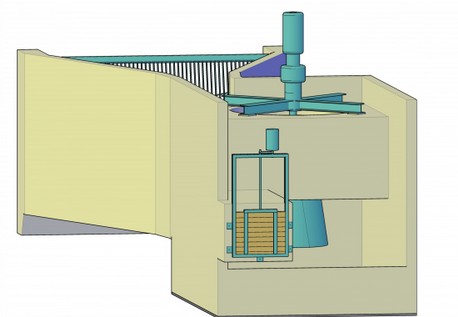
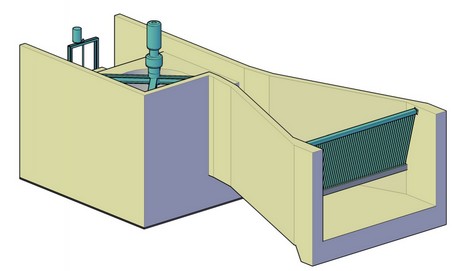
The smallest powerplant can be loaded into a minibus, while the large ones are made of concrete, steel and stainless steel.


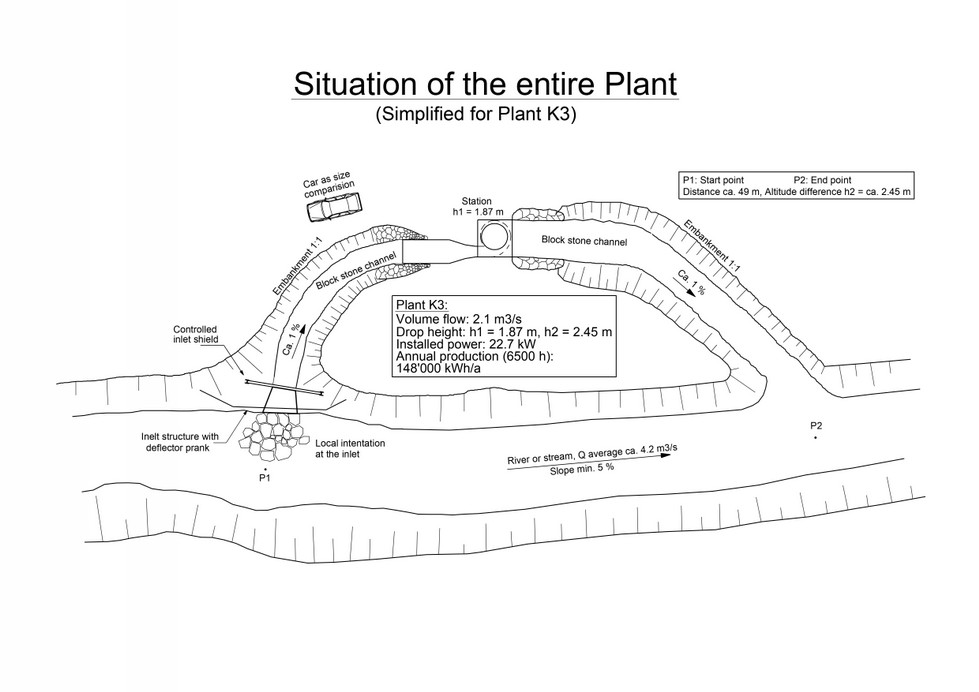
The drawings below show the schemes of a couple of systems with a car as a size comparison:
The power plants have various sizes:
KX - Kompakt WASSERKRAFTWERK
Fall height - 0.58m
Volume flow - 0.116 m3/s
Installed power – 0.38 kW
Production up to 3'300 kWh/a
Diameter basin – 0.88 m
Volume flow - 0.116 m3/s
Installed power – 0.38 kW
Production up to 3'300 kWh/a
Diameter basin – 0.88 m
K0 - Kompakt WASSERKRAFTWERK
Fall height of the system h1 = 0.66 m
Total fall height h2 = 0.85 m
Volume flow - 0.16 m3/s
Installed power – 0.58 kW
Production up to 5'100 kWh/a
Diameter basin – 0.99 m
Total fall height h2 = 0.85 m
Volume flow - 0.16 m3/s
Installed power – 0.58 kW
Production up to 5'100 kWh/a
Diameter basin – 0.99 m
K1 - Kompakt WASSERKRAFTWERK
Fall height of the system h1 = 0.93 m
Total fall height h2 = 1.20 m
Volume flow - 0.39 m3/s
Installed power – 2 kW
Production up to 17'500 kWh/a
Diameter basin – 1.40 m
Total fall height h2 = 1.20 m
Volume flow - 0.39 m3/s
Installed power – 2 kW
Production up to 17'500 kWh/a
Diameter basin – 1.40 m

K2 - Kompakt WASSERKRAFTWERK
Fall height of the system h1 = 1.41 m
Total fall height h2 = 1.85 m
Volume flow – 1.07 m3/s
Installed power – 8.6 kW
Production up to 75'000 kWh/a
Diameter basin – 2.10 m
Total fall height h2 = 1.85 m
Volume flow – 1.07 m3/s
Installed power – 8.6 kW
Production up to 75'000 kWh/a
Diameter basin – 2.10 m
K3 - Kompakt WASSERKRAFTWERK
Fall height of the system h1 = 1.87 m
Total fall height h2 = 2.45 m
Volume flow – 2.1 m3/s
Installed power – 22.7 kW
Production up to 200’000 kWh/a
Diameter basin – 2.80 m
Total fall height h2 = 2.45 m
Volume flow – 2.1 m3/s
Installed power – 22.7 kW
Production up to 200’000 kWh/a
Diameter basin – 2.80 m
K4 - Kompakt WASSERKRAFTWERK
Fall height of the system h1 = 2.34 m
Total fall height h2 = 3.05 m
Volume flow – 3.9 m3/s
Installed power – 53.7 kW
Production up to 470’000 kWh/a
Diameter basin – 3.50 m
Total fall height h2 = 3.05 m
Volume flow – 3.9 m3/s
Installed power – 53.7 kW
Production up to 470’000 kWh/a
Diameter basin – 3.50 m
K5 - Kompakt WASSERKRAFTWERK
Fall height of the system h1 = 2.80 m
Total fall height h2 = 3.65 m
Volume flow – 5.9 m3/s
Installed power – 100 kW
Production up to 875’000 kWh/a
Diameter basin – 4.20 m
Total fall height h2 = 3.65 m
Volume flow – 5.9 m3/s
Installed power – 100 kW
Production up to 875’000 kWh/a
Diameter basin – 4.20 m
K6 - Kompakt WASSERKRAFTWERK
Fall height of the system h1 = 3.27 m
Total fall height h2 = 4.30 m
Volume flow - 9 m3/s
Installed power – 173 kW
Production up to 1’500'000 kWh/a
Diameter basin – 4.90 m
Total fall height h2 = 4.30 m
Volume flow - 9 m3/s
Installed power – 173 kW
Production up to 1’500'000 kWh/a
Diameter basin – 4.90 m
K7 - Kompakt WASSERKRAFTWERK
Fall height of the system h1 = 3.73 m
Total fall height h2 = 4.90 m
Volume flow – 12.5 m3/s
Installed power – 274 kW
Production up to 2'400’000 kWh/a
Diameter basin – 5.60 m
Total fall height h2 = 4.90 m
Volume flow – 12.5 m3/s
Installed power – 274 kW
Production up to 2'400’000 kWh/a
Diameter basin – 5.60 m
Even more plants, larger than the K7 are possible.
With bigger plant sizes, the performance develops more than the increase in volume of the water. Thus larger the power plants are, the more economic potential they have.
For whom
Energy production companies that have their own power plant fleet and also own hydroelectric plants.
The K4 to K7 and even bigger ones of Kompakt WASSERKRAFTWERKE.
Private persons, families, communities and companies who want to generate their own electricity
The KX to K7 and even bigger ones of Kompakt WASSERKRAFTWERKE.
Private buildings, farms and small settlements
The KX to K3 of Kompakt WASSERKRAFTWERKE.
Construction companies and the military for genius work
The KX to K3 of Kompakt WASSERKRAFTWERKE.
Often, even very often, construction companies or the military need electricity precisely where there is none, e.g. in bridge building, road construction or engineering work
Executed projects
Sibiu county, Romania – 25 km from Sibiu city
Brasov county, Romania – 15 km from Brasov city
Sibiu county, Romania – 25 km from Sibiu city
Brasov county, Romania – 15 km from Brasov city
ROI - Return of Investment
We have here a very good paid back rate.
The diagram below from the Paul Scherrer Institute shows the ROI for various generation methods. Our Kompakt WASSERKRAFTWERKE are in the range of conventional run-of-river power plants. Larger plants from K4 upwards are even better than run-of-river power plants.

The installed power is given in kW
The installed power is often spoken of. But this size says not so more. In order to make comparisons between different generation methods, annual electricity production is more meaningful and can be calculated in monetary terms.
Some energy production methods only work for some hours or at partial load at times, especially photovoltaics and wind. So, in order to calculate the energy generated, the average duty cycle over a longer period of time, usually a year, must also be known.
Annual utilization factor or capacity factor - Shows the full load hours per generation method:
Voltaic systems around 10%, wich is 876 hours off full charge per year
Wind turbines around 20%, wich is 1753 hours off full charge per year
Hydro system KW2 around 75%, wich is 6570 hours off full charge per year
Voltaic systems around 10%, wich is 876 hours off full charge per year
Wind turbines around 20%, wich is 1753 hours off full charge per year
Hydro system KW2 around 75%, wich is 6570 hours off full charge per year
Voltaics and wind are volatile generation methods and are not base load capable. In opposition, hydro is base load capable.
Voltaic systems provide electricity just when the sun is shining, very little in rainy weather and no electricity at night.
Wind turbines supply electricity just depending on the wind strength, not electricity when there is calm.Hydro systems supply electricity depending on the amount of water, but continuously.
Comparison example of installed power
Voltaic system 1000 kW
Wind turbine 500 kW
Hydro system KW2 133 kW (one of our systems between K5 -100 kW and K6 - 173 kW). This corresponds to an annual production of 876,000 kWh/a for all 3 types of generation. It is evident that the installed capaticity varies significantly.
Wind turbine 500 kW
Hydro system KW2 133 kW (one of our systems between K5 -100 kW and K6 - 173 kW). This corresponds to an annual production of 876,000 kWh/a for all 3 types of generation. It is evident that the installed capaticity varies significantly.
Energy production is given in kWh and kWh/a
This production can be calculated in money and so you can calculate the income, yield, return of investment etc. The installed power cannot serve this purpose. This only shows the maximum performance of the system, depending on the annual utilization level.
This production can be calculated in money and so you can calculate the income, yield, return of investment etc. The installed power cannot serve this purpose. This only shows the maximum performance of the system, depending on the annual utilization level.
In addition and in general, there are external costs:
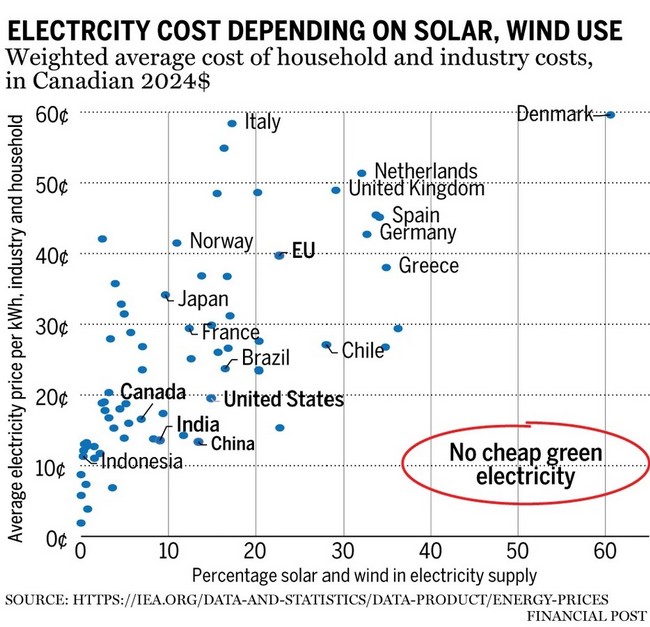
If voltaics or wind turbines feed full power into the grid, there are significant external costs because they produce volatile electricity that is unusable. Since production must always adapt to current demand, laws require energy suppliers to purchase this electricity. This means that additional base-load power plants must be available, which greatly increases the overall production costs. They have to go further.
Networks are being expanded, which also increases costs. Countries with a high proportion of voltaic and wind power therefore also have high electricity prices that consumers have to pay (cogeneration tax – which can be found in every electricity bill).
As soon as these compulsory laws are abolished, a voltaic or wind system will no longer be able to feed into the grid in economical and attractive terms.Tabular summary of the comparison voltaic, wind and KW2 hydro

